- Business
- Apparel Redefined
- Industry and size
- Apparel decoration, Chicago
- Orders waiting a week to start
- 75% fewer Down from 1 in 10 to 1 in 40, in weeks just as busy as before.
- How long
- 30 days
- Finished
- March 2026
Case study · 5 min read
One order in ten sat on the dock a week or more before anyone could start making it.
What was going wrong
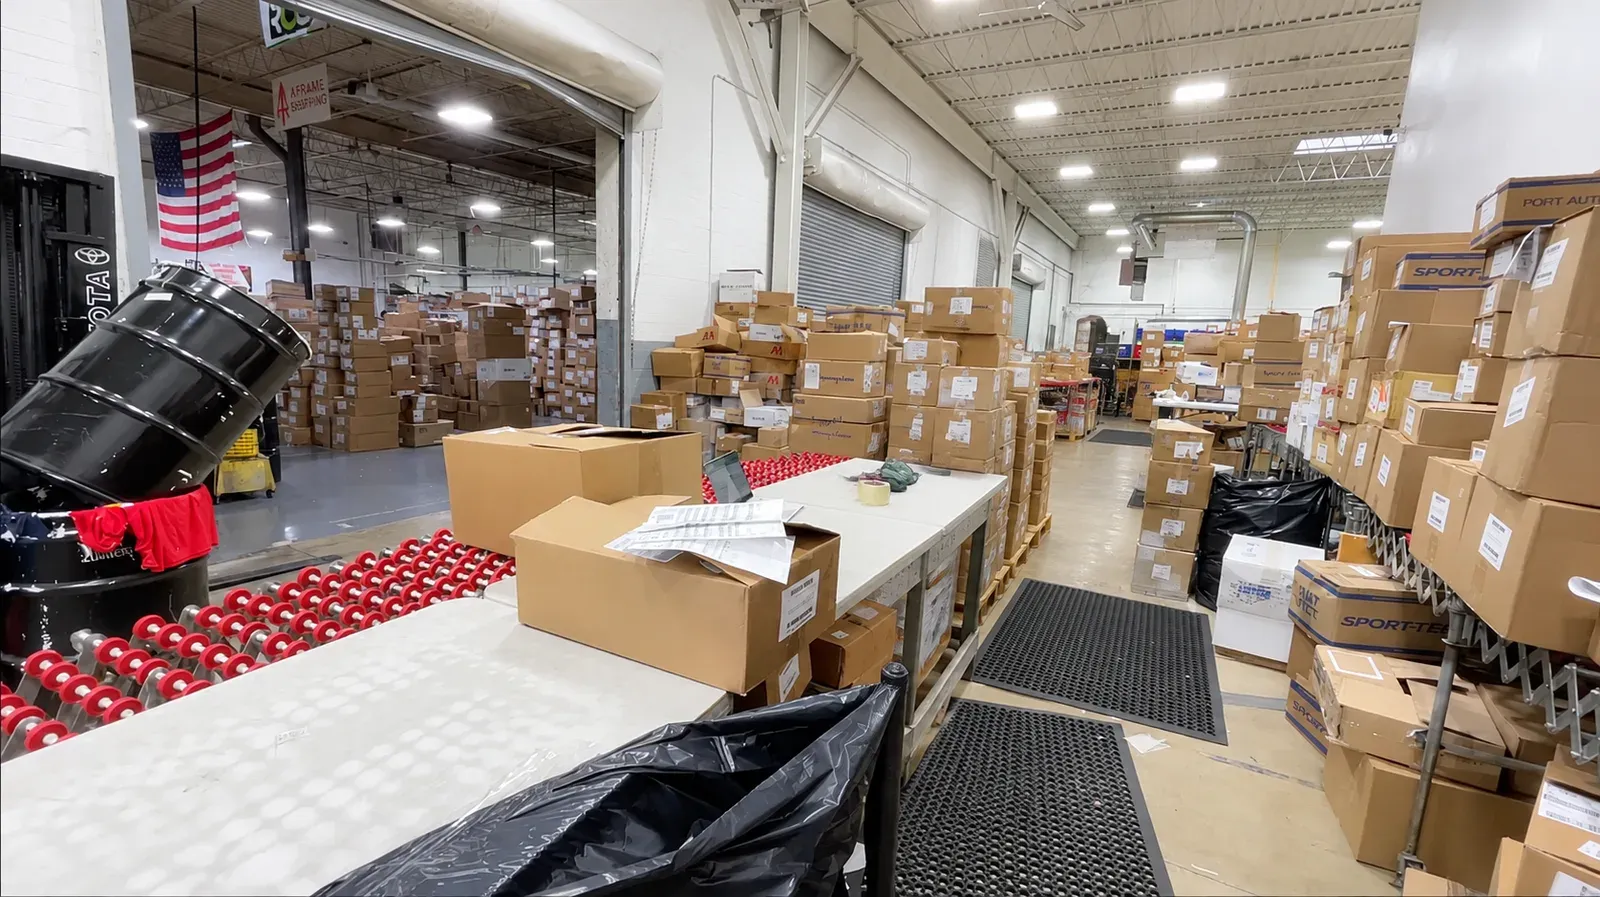
Apparel Redefined prints and embroiders clothing in Chicago. Blank garments arrive from suppliers by the carton. Before anything can be printed, someone has to work out which customer order a carton belongs to.
That was the hard part. The box carries a tracking number from the carrier. NOMOS, the system that runs their orders, had never known which tracking number belonged to which order, so a receiver worked it out by hand. In January I found they got it right on the first try about half the time.
When it went wrong the box waited. The usual fix was to hold every carton in a group until all of them landed, open them, and sort garments by color and size until the pile matched the paperwork. That took between one and five hours.
One order in ten then sat a week or more before anyone could start making it. In the worst week it was more than half of them. That happened in 2023, again in 2024, and again in 2025. Nobody had put a cost on it, because it showed up as delay and never as a bill.
What I found
None of the information was missing. S&S Activewear, their largest supplier, knew what it had packed in each box, the carrier knew when the box arrived, and NOMOS held every open order. The three had just never met at the moment a receiver was standing in front of the carton.
The company could also already prove what it cost. NOMOS has stamped two moments on every order since 2019: when a package was logged in, and when the count was finished. The gap between them is how long a box sat. Nobody had ever looked at it.
So I did not have to build a baseline. There were already three years of the same measure, over the same months of each year, from before I touched anything.
What changed
A receiver now scans the tracking barcode on the box. One screen answers the question: this is the order, this is what should be inside this carton, and this is how sure I am. Then they count it in. It took thirty days to build and went live on the first of February.
The tool changed nothing else. NOMOS was not changed, and nobody types anything they did not type before. The tool sits in front of the order system and answers the one question that was costing the week.
Orders stuck a week or more fell from one in ten to one in forty. That is the finding I would defend hardest, because it is the one that held up every time I attacked it.
Speed moved much less. Receiving takes about half a day less per order than it did in the two normal years before this, and a full day less on the largest orders. Orders reach customers about half a day sooner, and the dock accounts for all of it. Production gave a little back. On the smallest orders, which are most of them, the dock got faster and the customer never felt it.
The biggest change is one an average hides. Receiving used to come apart in the busy months, when up to one order in four sat a week or more. It did that in each of those three years, and it has not so far in 2026.
One change nobody asked for: when the pile got bad, people from other jobs used to be pulled onto the dock to help, and that has mostly stopped.
What I checked before I believed it
First, whether the crew had simply started typing better dates. They had. It makes the result bigger, not smaller: measured against the carrier's own delivery times instead of anything staff entered, the share of orders stuck a week fell from 7.7% to 0.7%.
Then, whether there was simply less work. There was. Orders were down, and the orders themselves got smaller. So I threw the year-on-year comparison away and rebuilt it. I lined up only the weeks where the crew handled the same weight of work, garment for garment: thirty eight weeks before, seventeen weeks after, with the weeks after running slightly heavier. Stuck orders came out at 10.6% before and 2.6% after. Matching on workload did not move the answer.
Third, which year I was measuring against. 2025 was a slow year here for reasons that have nothing to do with receiving. Comparing 2026 against 2025 alone credits the tool with recovering somebody else's bad year. Against the two normal years, holding order size steady, about half a day came off the total, not the three days I first wrote down.
The correction also made one result stronger. Time at the dock fell in every size of order, and it fell further the bigger the order was: about half a day under 25 garments, three quarters at 25 to 49, a full day over 100. More garments means more boxes, and more boxes means more identification, so a tool that fixes identification should help the big orders most. It does, in order, with no exceptions. The starting point was about the same for every size, so big numbers shrinking faster does not explain it. That pattern is the tool's fingerprint, and it is the best evidence I have that the tool caused the drop.
On the smallest orders, which are most of them, the half day gained at the dock went back out again in production, so those customers did not get their work any sooner. That problem sits in production, and it is the next thing worth looking at.
Fourth, my own number. I had written that the busy weeks now held room worth about $128,000 a year, on the assumption there were ten such weeks a year. So I counted them. In three years of weekly records there were four, not thirty. Then I checked the assumption underneath that one: whether being busy had ever been what made orders stick. It had not. How busy a week was explains about 2% of whether its orders got stuck, and the single busiest week in the whole record had an ordinary rate of delays, a little below average. The $128,000 rested on a ceiling that was never there, so I deleted it rather than making it smaller.
The same counting cuts into the labor number. Receiving hours fell, but so did the garments arriving, so some of those hours left with the work rather than because of the tool. What I can measure directly is the lookup itself: twenty seven seconds saved on every box, worth roughly $2,800 a year. Above that sits the re-handling that stopped happening, which is real and which I have not measured. So the range is $2,800 to $21,000 a year, and the number I stand behind is the floor.
Find where your business is losing money.
The Free Process Map takes under 8 minutes and shows what to fix first.