- Business
- Apparel Redefined
- Industry and size
- Apparel decoration, Chicago
- Orders finishing 5+ days late
- 62% fewer Down from 6.4% of orders to 2.4%, April to August, against the 2023 and 2024 average. Lower in each of the five largest accounts.
- How long
- 63 days
- Finished
- March 2026
Case study · 3 min read
The shop found out an order was late when the customer did.
What was going wrong
Apparel Redefined prints and embroiders clothing in Chicago. They make thousands of orders a year, for wholesale partners, online stores, and customers who order direct.
Every order passes through four systems: the one that runs production, the one sales uses, the supplier's, and accounting. None of them could answer the questions the owners asked every day. How long do our jobs really take? What is in the queue right now? Which orders are about to miss their date?
So the team found out an order was late when the customer did. Every fix came after the fact.
What I found
Once I put the order history in one place, two things everyone believed turned out to be wrong.
The first was skipped steps. Lots of orders seemed to skip a step, and it looked like sloppy work. It was not. Each kind of decoration has its own normal path through the shop. Screen print jobs skip the in-production step 62% of the time, because that is how screen print works. Judging every order against one path made healthy orders look broken, and hid the ones that really were.
The second was what makes a job slow. Mostly it was the customer, not the job. A few large accounts make up most of the orders, and the same kind of decoration can take more than twice as long for one of them as for another. A shop-wide average would warn about the wrong orders. Each order had to be judged against its own customer's normal pace.
What changed
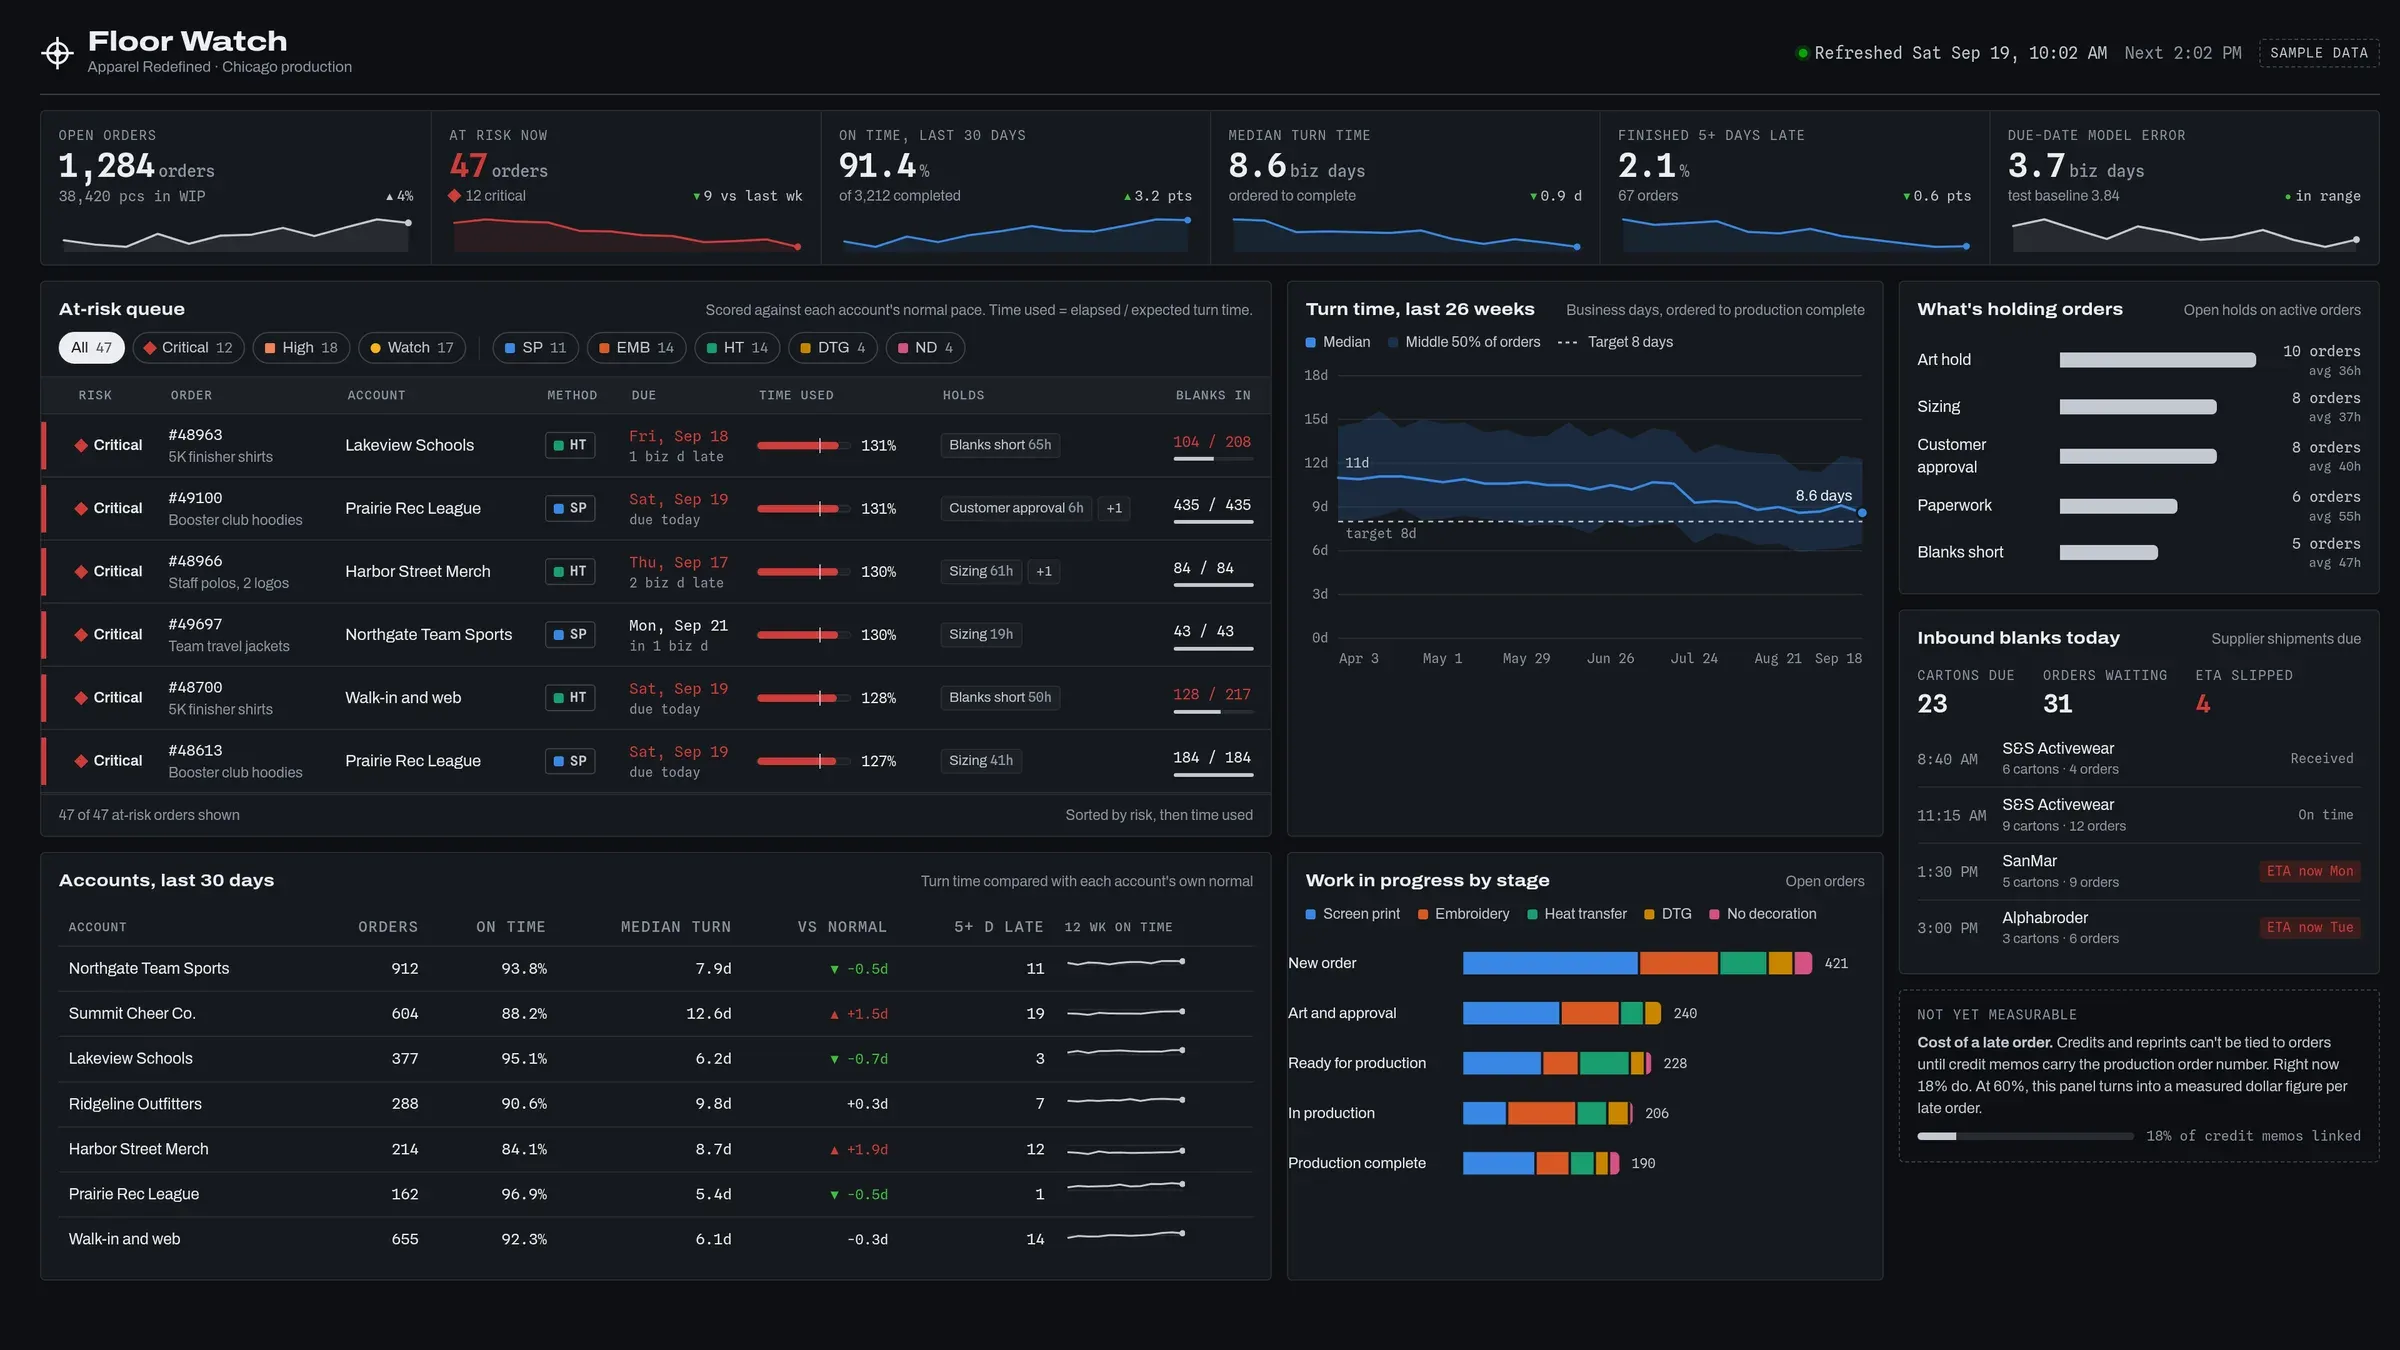
I joined the four systems into one order history that refreshes every four hours.
On top of it sits a list of orders at risk. Every open order gets a score for how much of its time it has used, measured against that customer's normal pace. The list also flags what is holding an order up: art, sizing, paperwork, or blank garments that have not arrived.
The owners can now see on-time and turn time by customer and by kind of decoration. And when an order is taken, a model suggests the earliest due date the shop can really hit. Half its guesses land within four working days.
It went live in March 2026. From April to August, 2.4% of orders finished more than five days late. In the same months of 2023 and 2024, it was 6.4%. Orders ten or more days late fell from 2.8% to 1.2%.
Our managers are back to leading with clear and reliable data. Working with Rapid Insights has been a win for our team. They delivered exactly what we needed through smart data analysis, performance tracking, dashboard development, and production capacity planning. Nothing feels impossible when Rapid Insights is involved. We highly recommend their work.
What I checked before I believed it
First, whether 2025 was just a bad year. For this measure it was not. Badly late orders were 7.4% in 2023, 5.6% in 2024, and 6.7% in 2025. I still left 2025 out of the baseline and compared against the average of 2023 and 2024.
Second, whether the mix of work changed. A drop in one big customer could be luck. So I checked the five largest one at a time. Every one of them is lower in 2026 than in any year before, and the one that had been worst dropped the most.
Third, turn time. I do not claim it. Jobs got faster than in 2025, but not faster than in 2023 and 2024, because a large customer with longer jobs grew into a big share of the orders.
Fourth, the money. A late order costs the shop in credits, discounts, and reprints. The books show what the shop spends each year on credits and rework. If a badly late order draws 5 to 10 times the average credit, the drop is worth $11,000 to $22,000 a year. That multiple is my estimate, not a measurement, so it stays off the headline. The true cost is higher than the books show, because the garments, ink, and press time for a reprint are booked as normal production.
Fifth, the part I have not settled. The receiving fix went live a month earlier, at the same shop. An order stuck on the dock for a week is very likely to finish late, so some of this drop may belong to that fix. I have not split the two apart yet. The test is to look only at orders that never got stuck at the dock. Until I run it, read this result as what the two fixes did together.
Two things would make this number stronger. Credit memos already have a field for the production order number. If staff fill it in, the guessed cost of a late order becomes a measured one. And logging what the team does when an order shows up at risk would show which of those fixes work.
Find where your business is losing money.
The Free Process Map takes under 8 minutes and shows what to fix first.